
GLOBAL IONOSPHERE RADIO OBSERVATORY
with Real-Time & Retrospective HF Ionospheric Sounding Data from Lowell DIDBase
Drift Data Info
Doppler Skymap:
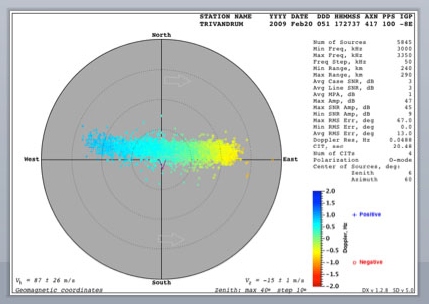
- Skymap presents ionospheric echoes in 2D sky coordinate system that maps the echoes ("sources") onto a 2D fundamental skymap plane using their azimuth and zenith arrival angles, thus discarding the range information
- The skymap plane presents the zenith angle as radius and azimuth angle as polar angle of the polar coordinate system
- Color is mapped to the Doppler frequency shift, with red shades corresponding to receding plasma, blue shades - to approaching plasma, and green shades - to slowly moving plasma
- Observed Doppler frequency shift is converted to the light-of-sight (LOS) velocity that is further split into horizontal and vertical components
- Drift Data Analysis (DDA) technique treats the whole area of ionosphere illuminated by Digisonde signal as a single entity moving at the same bulk drift velocity
- DDA uses the least squares fit method to obtain best fit of all sources visible on the skymap with their individual Dopper velocities to compute the LOS bulk velocity vector
- Calculated horizontal and vertical drift velocity components are shown in the skymap using the arrow symbols
- Skymaps are also used to determine the center of reflections that corresponds to the large-scale tilt of the ionospheric plasma distribution in the reflecting area The example from Trivandrum digisonde in India shows a classic nighttime zonal drift of ionization bubbles across the station from West to East
Time series of the DDA bulk drift velocity:
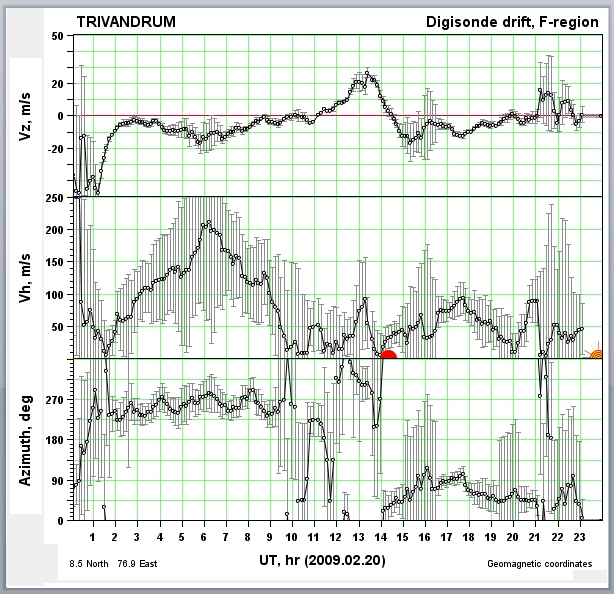
- Drift velocity vector is presented by one chart of the vertical velocity component Vz and two charts of the horizontal velocity components that can use either Cartesian (East and North components ) or cylindrical (asimuth and radial components) representations
- Error bar indicate how well the bulk velocity vector represents underlying skymap sources
- Larger error bars correspond to greater deviation of observed plasma motions in the skymap from the collective bulk motion assumed by DDA algorithm
- Local sunrise and sunset times are labeled appropriately in the central panel of the plot
- This example velocity plot from Trivandrum digisonde shows classic signatures of the equatorial plasma drift: (1) westward daytime zonal drift at ~270° azimuth, (2) eastward mighttime drift at ~90° azimuth, and (3) vertical uplift of the plasma in response to the pre-reversal enhancement of the electric field during evening hours