
GLOBAL IONOSPHERE RADIO OBSERVATORY
with Real-Time & Retrospective HF Ionospheric Sounding Data from Lowell DIDBase
Ionogram Data Info
Ionogram:
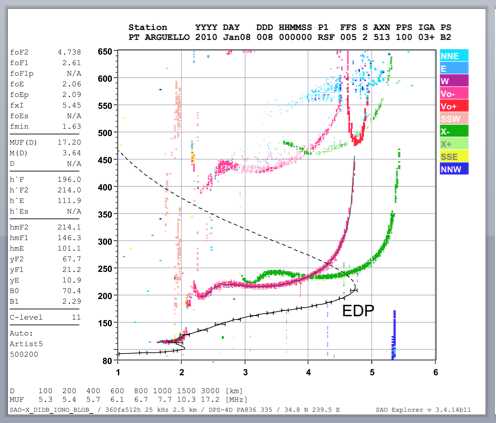
- Digisonde ionogram presents signals reflected from the ionosphere in the frequency vs travel time frame, with signal strength indicated by the pixel intensity, and wave polarization, angle of arrival, and Doppler frequency indicated by colors
- Individual reflected signals (echoes) observed on each sounding frequency form traces in the ionogram image
- Red (green) colors indicate vertical echoes with O-polarization (X-polarization)
- ARTIST software scales the ionogram and calculates the vertical Electron Density Profile (EDP) in real time
- Thin black lines show the ARTIST-identified O-traces
- The black line with uncertainty bars shows the calculated bottomside EDP
- Extraction and interpretation of the signal traces in ionogram images is an intelligent, machine-hard problem of feature recognition
Directogram:
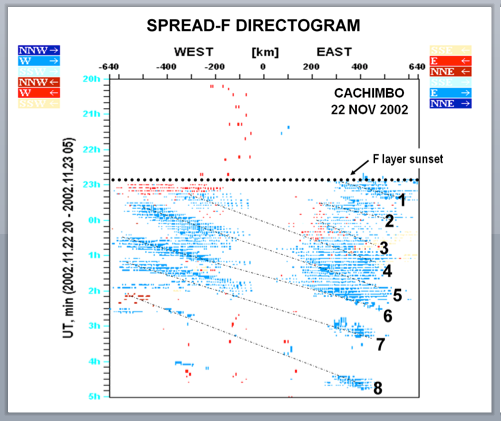
- Digisonde Spread-F Directogram displays time history of echoes propagating off-vertically after reflecting from irregular plasma structures
- Y-axis is time, and X-axis is horizonal distance in the ionosphere to the reflection point, with 0 corresponding to the sounder location
- Vertical echoes are not shown; blank directogram means quiet (horizontally stratified) ionosphere
- Signatures in the directograms indicate development of Spread F conditions
- Doppler sign of echoes is analysed to label plasma structures approaching on one side and departing to the other side with the same color
- In the example directogram, development and eastward drift of 8 plasma bubbles is detected by Cachimbo digisonde in Brazil