
GLOBAL IONOSPHERE RADIO OBSERVATORY
with Real-Time & Retrospective HF Ionospheric Sounding Data from Lowell DIDBase
SAO Explorer
Common SAO Explorer
Data Visualizations and Tools
- SAO Explorer is the flagship software tool for working with GIRO ionograms
- Download and user-guide link: https://ulcar.uml.edu/SAO-X/SAO-X.html
- SAO-X has capability of accessing ionograms and ionogram-derived data from 60+ locations in the Lowell DIDBase (via TCP/IP port 3050)
- DIDBase is Digital Ionogram DataBase
- 14+ million ionogram images
- 15+ million ionogram-derived records
- Web Portal access to ionogram images: http://ulcar.uml.edu/DIDBase/
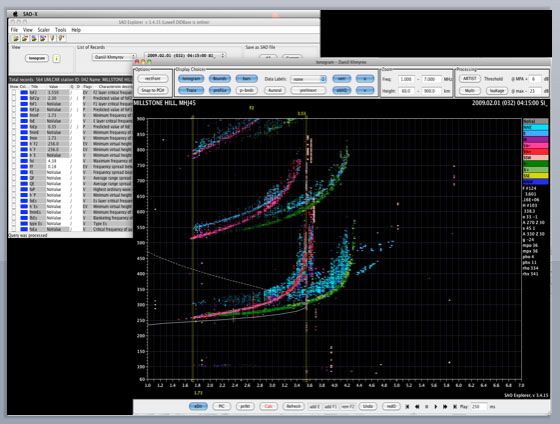
- Interactive ionogram scaling environment
- Mouse-driven leading edge highlighter
- ARTIST-5 autoscaling algorithm to reduce overall manual effort
- Profile inversion algorithm NHPC
- Visualization controls, including content selectors, data labels, and detail-on-demand context window
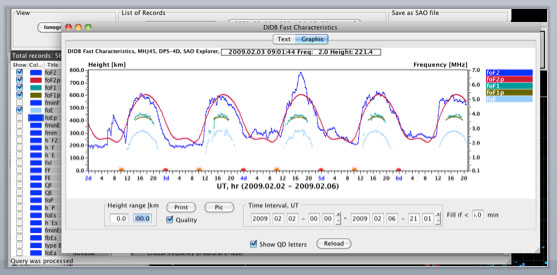
DIDB Fast Characteristics
- Time series of common ionospheric characteristics
- IRI-2001 model values available for comparisons
- Plain text export for external data analysis
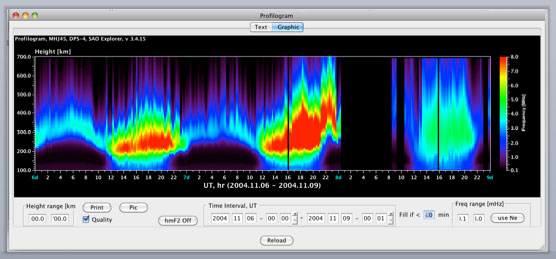
Profilogram
- Time history of the vertical profile of electron density
- X axis is time, Y axis is altitude, and color is mapped to plasma density
- Example from Millstone HIll observatory illustrates ionospheric response to a strong interplanetary shock event