GAMBIT "weather-minus-climate" anomaly maps: deviations from the quiet-time expected behaviorSTORM EVENT: September 27-29, 2020. |
Background: North Polar Projection
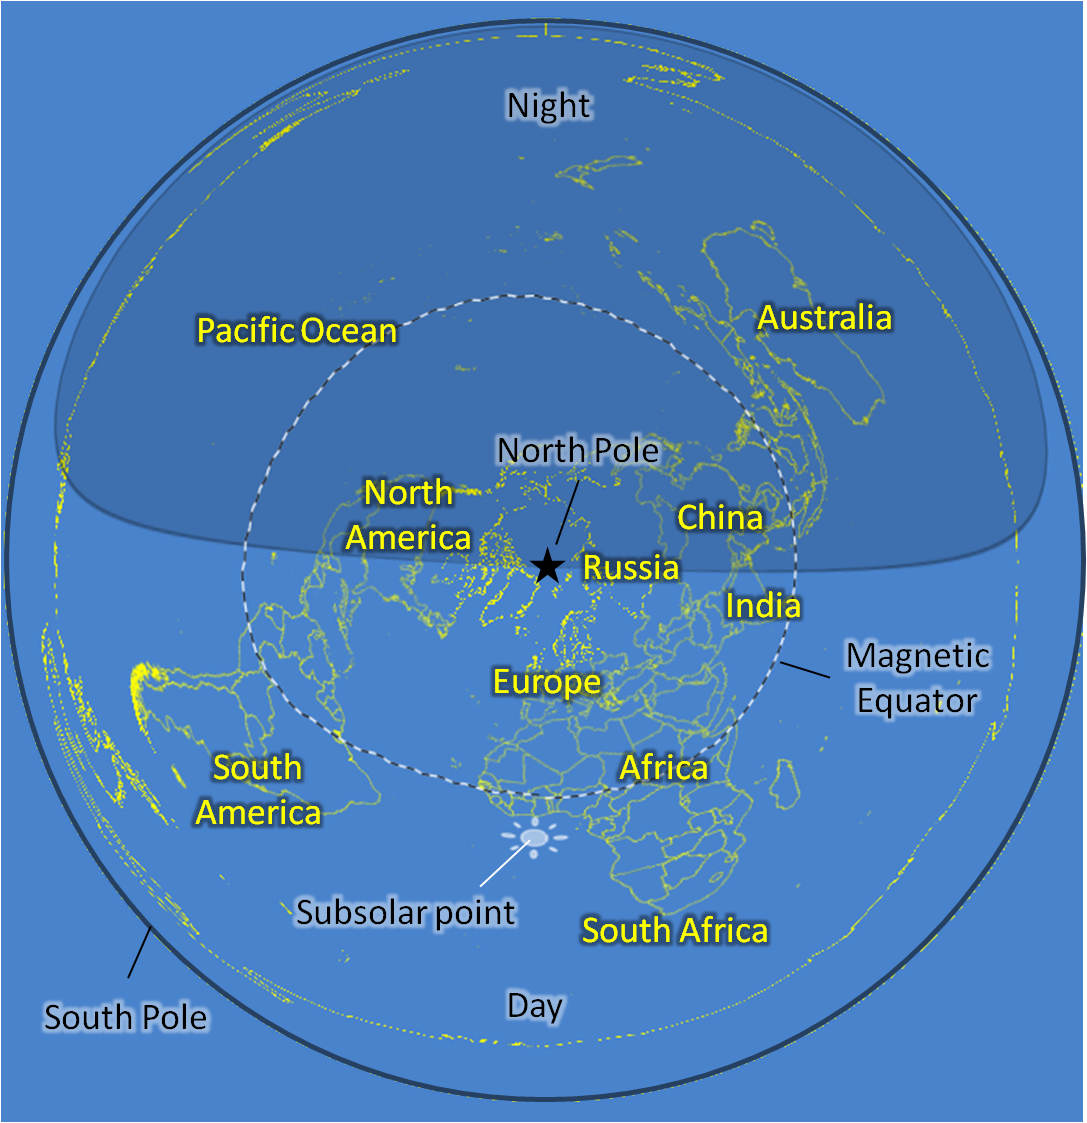 |
Please familiarize yourself with the North Polar projection used in these Anomaly Maps. The North pole is at the center of the map circle. The lon-lat grid of the globe is gradually stretched as the latitude decreases. The South pole is stretched along the border of the outer circle. This projection emphasizes the Northern hemisphere that has a better sensor coverage. Subsolar point is indicated with a Sun symbol. The night-time area is shadowed. |
Background: GIRO measurements and local and global weather computation
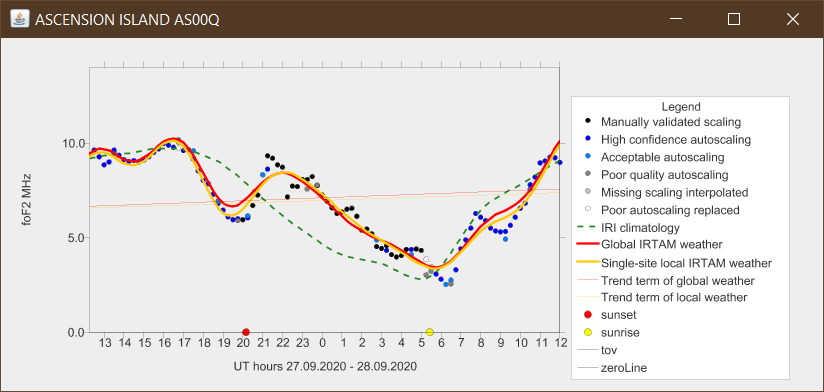 |
One IRTAM weather computation uses 24-hour history of measurements prior to the target time. In this example, measurements are shown as blue/gray/black dots. IRI quiet-time prediction is shown as green dashed line. Global IRTAM weather computation produces 24-hour timeline of variation (red line). Next computation will occur 15 minutes later and will also cover 24-hour period of time, shifted forward by 15 minutes. Yellow line is a local weather computation valid for vicinity of the Ascension Island observatory. Ascension Island Digisonde data courtesy USAF NEXION program. NEXION Program Manager is Mark Leahy |
Anomaly Map Animations: 24-hour noon-to-noon histories on 2020 Sep 27-29
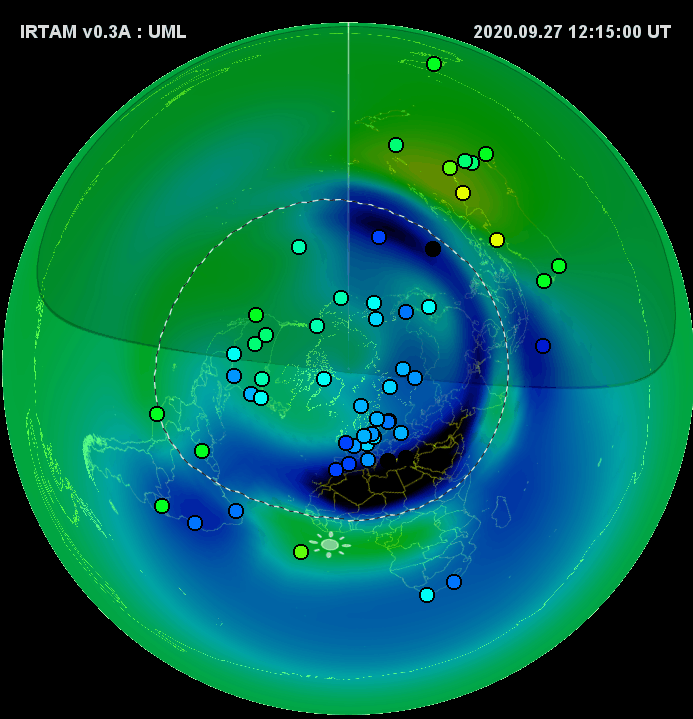 |
GAMBIT 24-hour Anomaly map | Not for publication F2 layer Peak Density NmF2 Color surface: weather-minus-climate IRTAM computation Color dots: measurement-minus-climate GIRO observations |
 |
|
 |
GAMBIT 24-hour Anomaly map | Not for publication F2 layer Peak Density NmF2 Color surface: weather-minus-climate IRTAM computation Color dots: measurement-minus-climate GIRO observations |
|
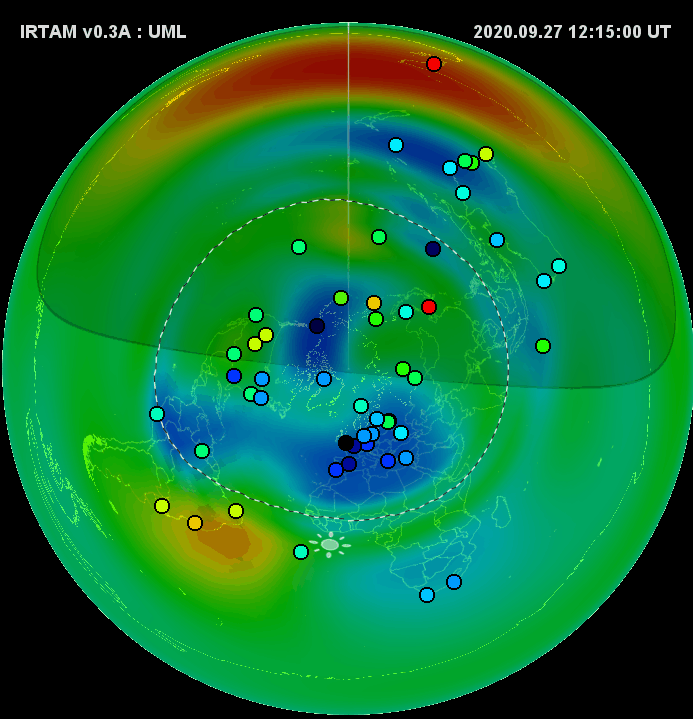 |
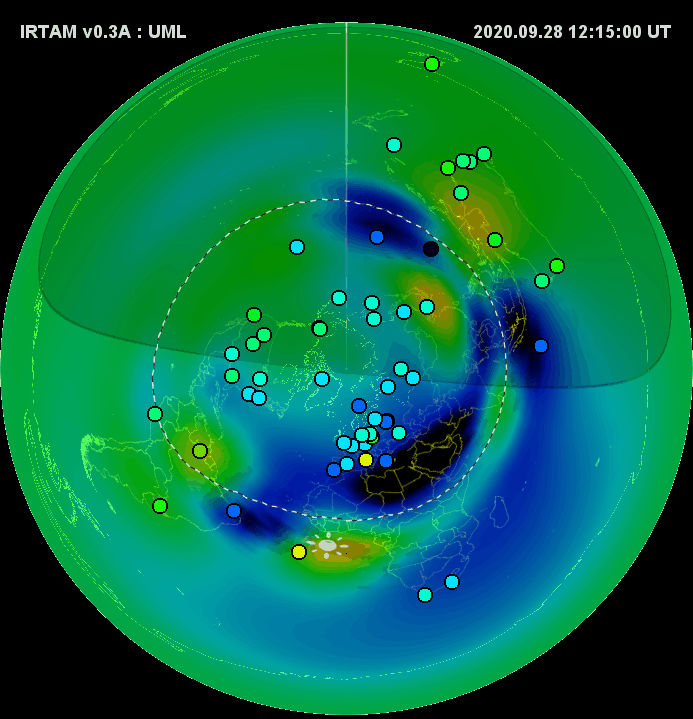
GAMBIT 24-hour Anomaly map | Not for publication F2 layer Peak Height hmF2 Color surface: weather-minus-climate IRTAM computation Color dots: measurement-minus-climate GIRO observations |
 |
|
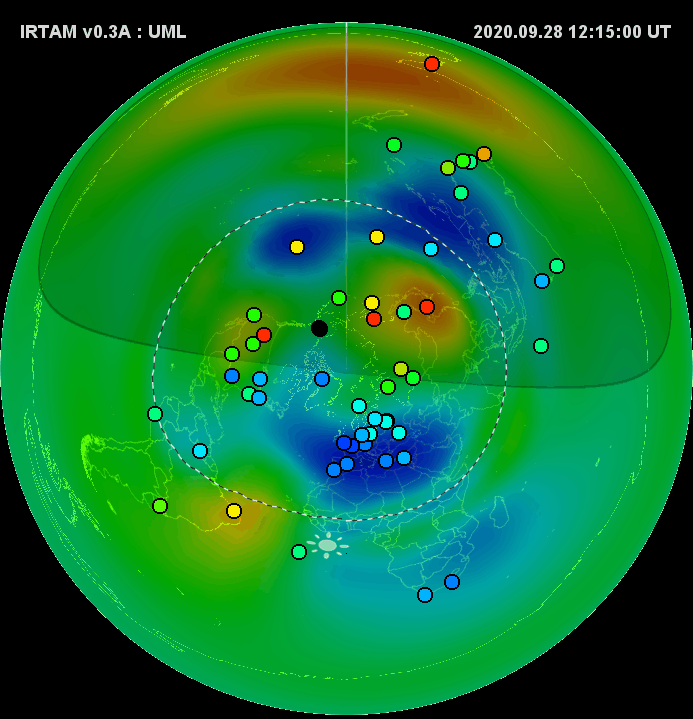 |
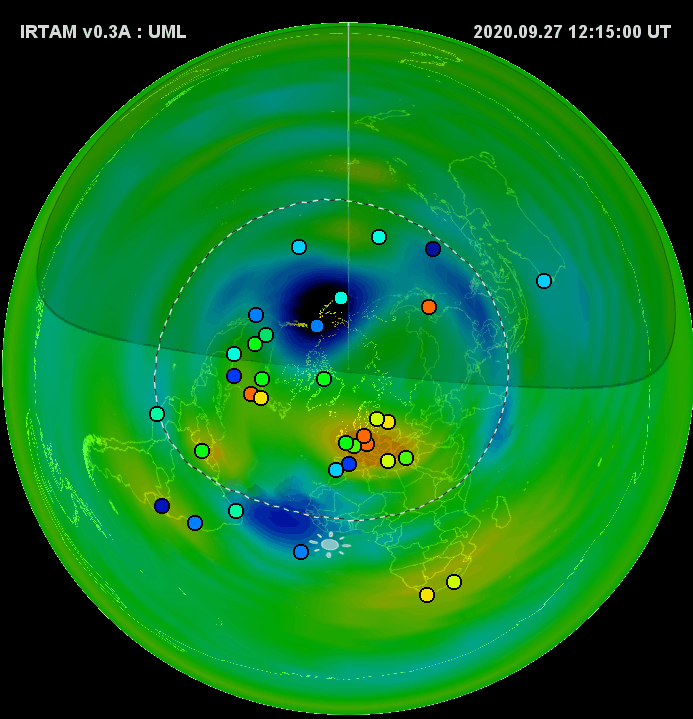
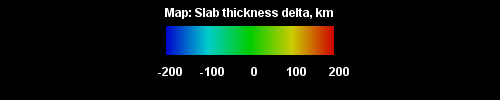
GAMBIT 24-hour Anomaly map | Not for publication F2 layer Peak Height hmF2 Color surface: weather-minus-climate IRTAM computation Color dots: measurement-minus-climate GIRO observations |
|
 |
GAMBIT 24-hour Anomaly map | Not for publication F2 layer Profile Half-Thickness Parameter B0 Color surface: weather-minus-climate IRTAM computation Color dots: measurement-minus-climate GIRO observations |
 |
|
 |
GAMBIT 24-hour Anomaly map | Not for publication F2 layer Profile Half-Thickness Parameter B0 Color surface: weather-minus-climate IRTAM computation Color dots: measurement-minus-climate GIRO observations |
|
 |
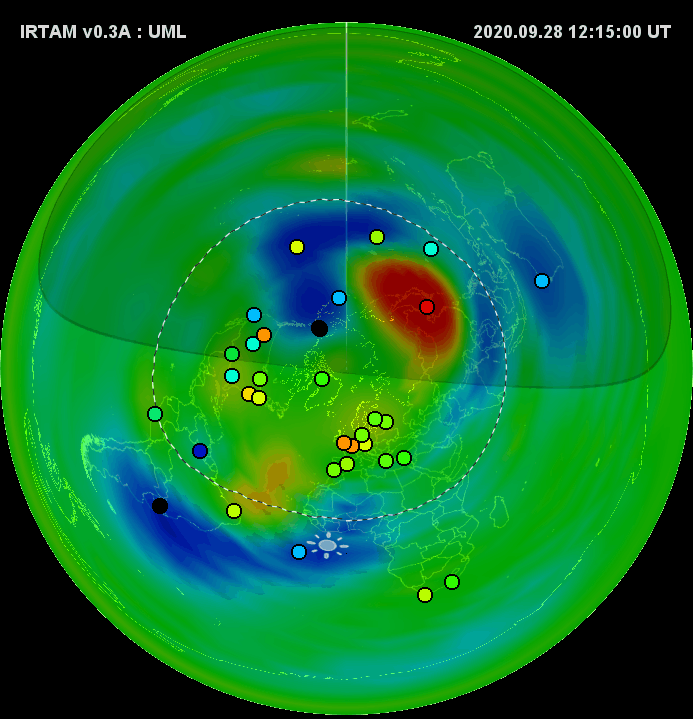
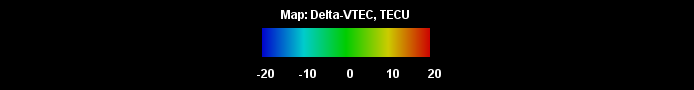
GAMBIT 24-hour Anomaly map | Not for publication Vertical Total Electron Content (VTEC) Credits: CEDAR Madrigal Repository, MIT Haystack Observatory Color surface: VTEC deviation from a quiet day reference |
 |
|
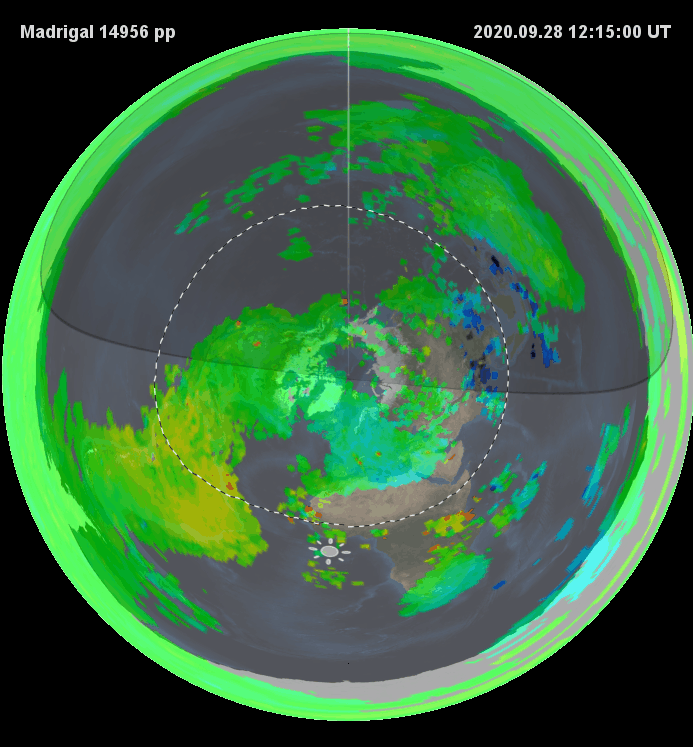 |
GAMBIT 24-hour Anomaly map | Not for publication Vertical Total Electron Content (VTEC) Credits: CEDAR Madrigal Repository, MIT Haystack Observatory Color surface: VTEC deviation from a quiet day reference |
|